Pearson Edexcel · A-Level · Mathematics
Course version: 9MA0 · Version from Mar 2026
Conduct a statistical hypothesis test for the mean of a Normal…
Full specification wording
Statistical hypothesis testing: 5.3 Conduct a statistical hypothesis test for the mean of a Normal distribution with known, given or assumed variance and interpret the results in context.
When a variable X is modelled as Normal with unknown mean μ but variance known, given or assumed, a sample mean x̄ from n independent observations is also Normal with mean μ and variance σ²/n, so…
Checked against the Pearson Edexcel 9MA0 specification (opens in a new tab) on .
- Point 3 of 3
- 3 key terms
Study notes
From the checked teaching notes for this specification point.
The idea
When a variable X is modelled as Normal with unknown mean μ but variance known, given or assumed, a sample mean x̄ from n independent observations is also Normal with mean μ and variance σ²/n, so its standard error is σ/√n. A hypothesis test sets H₀: μ = μ₀ against a one- or two-tailed H₁, then standardises: z = (x̄ − μ₀)/(σ/√n). For a two-tailed test at significance level α, reject H₀ if |z| exceeds the critical value z_(α/2); for a one-tailed test compare z with z_α in the correct direction. Equivalently compare x̄ with a critical region. The conclusion must refer to the original context: state whether there is sufficient evidence at the α level to reject H₀, and phrase the finding in terms of the real quantity measured, not merely 'accept H₀'.
What earns the marks
- State H₀ and H₁ clearly, choosing one- or two-tailed form from the wording of the problem and defining μ in context.
- Identify n, the sample mean x̄, the hypothesised mean μ₀ and the known, given or assumed standard deviation σ, then compute the standard error σ/√n.
- Calculate the test statistic z = (x̄ − μ₀)/(σ/√n), or find the critical region for x̄, showing the substitution accurately.
- Compare the test statistic with the appropriate critical value, or compare the sample mean with the critical region, and state the decision about H₀.
- Interpret the decision in the context of the question, referring to evidence about the population mean at the stated significance level.
Common mistakes and how to put them right
Using the sample standard deviation in place of the known, given or assumed population standard deviation when computing the standard error.
Put it right: The correct divisor is σ/√n with the stated σ.
Dividing by σ rather than σ/√n, which ignores sample size.
Put it right: The corrected standard error is σ/√n.
Choosing a two-tailed critical value for a one-tailed test, or comparing against the wrong tail.
Put it right: The corrected approach selects the critical value matching the direction of H₁.
Exam tips
- Write down H₀, H₁ and the significance level before any calculation so the tail direction is fixed.
- Show the standard error and the substitution into z explicitly; method marks are available for correct structure even if arithmetic slips.
- Finish with a sentence that names the context variable and states the strength of evidence at the given significance level.
Try the lesson
The start of the Statistical hypothesis testing: 5.3 Conduct a statistical hypothesis test for the mean of a Normal distribution with known, given or assumed variance and interpret the results in context. lesson, made from checked teaching notes for this specification point.
Have a go first
A cereal manufacturer claims that the mean mass of a box is 500 g. The masses are Normally distributed with a standard deviation of 12 g. A random sample of 36 boxes has a mean mass of 496.5 g. Test at the 5% significance level whether the mean mass is less than 500 g, and state the conclusion in context.
Listen
When a variable X is modelled as Normal with unknown mean μ but variance known, given or assumed, a sample mean x̄ from n independent observations is also Normal with mean μ and variance σ²/n, so its standard error is σ/√n. A hypothesis test sets H₀: μ = μ₀ against a one- or two-tailed H₁, then standardises: z = (x̄ − μ₀)/(σ/√n). For a two-tailed test at significance level α, reject H₀ if |z| exceeds the critical value z_(α/2); for a one-tailed test compare z with z_α in the correct direction. Equivalently compare x̄ with a critical region. The conclusion must refer to the original context: state whether there is sufficient evidence at the α level to reject H₀, and phrase the finding in terms of the real quantity measured, not merely 'accept H₀'. A strong answer earns marks for these points. State H₀ and H₁ clearly, choosing one- or two-tailed form from the wording of the problem and defining μ in context. Identify n, the sample mean x̄, the hypothesised mean μ₀ and the known, given or assumed standard deviation σ, then compute the standard error σ/√n. Calculate the test statistic z = (x̄ − μ₀)/(σ/√n), or find the critical region for x̄, showing the substitution accurately. Compare the test statistic with the appropriate critical value, or compare the sample mean with the critical region, and state the decision about H₀. Exam tip: Write down H₀, H₁ and the significance level before any calculation so the tail direction is fixed.
See it
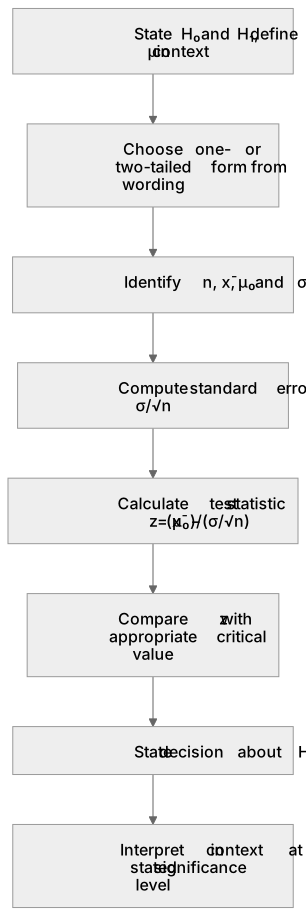
Put it in order
Put these steps in the order they happen.
- 1. Calculate test statistic z = (x̄ − μ₀)/(σ/√n)
- 2. Interpret in context at stated significance level
- 3. Compare z with appropriate critical value
- 4. State H₀ and H₁, define μ in context
- 5. Choose one- or two-tailed form from wording
- 6. State decision about H₀
- 7. Identify n, x̄, μ₀ and σ
- 8. Compute standard error σ/√n
Key words
Say what each word means before you turn the card.
Standard error
Try answering aloud or in your head before turning the card.
One-tailed and two-tailed critical regions
Try answering aloud or in your head before turning the card.
Contextual interpretation of significance
Try answering aloud or in your head before turning the card.
See every definition
- Standard error
- The standard error is σ/√n, the square root of the variance σ²/n of the sample mean from n independent observations.
- One-tailed and two-tailed critical regions
- A two-tailed test at significance level α rejects H₀ if |z| exceeds z_(α/2), while a one-tailed test compares z with z_α in the correct direction.
- Contextual interpretation of significance
- The conclusion must state whether there is sufficient evidence at the α level to reject H₀, phrased in terms of the real quantity measured.
Label the diagram
Some boxes have lost their names. Pick the right name for each number.
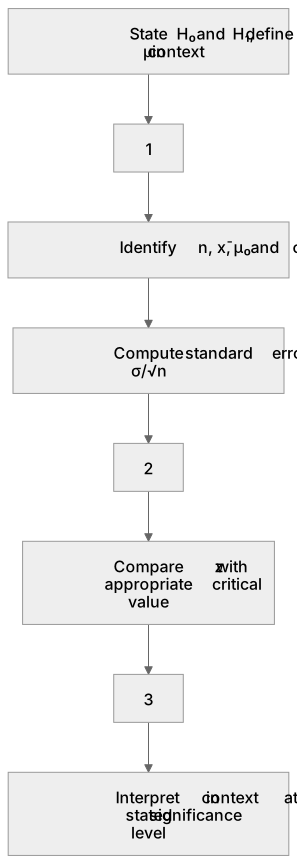
1Box 1
2Box 2
3Box 3
There is more to this lesson
The full lesson goes on to check your understanding and help you earn the marks. Create a free account to carry on, with your progress saved.
A week of Premium from your first lesson · Then the free plan continues · No card, no charge
Test your understanding of Statistical hypothesis testing: 5.3 Conduct a statistical hypothesis test for the mean of a Normal distribution with known, given or assumed variance and interpret the results in context.
Active recall beats re-reading. Take an instant quiz now to test what you’ve learned and lock it into long-term memory.
A week of Premium from your first lesson · Then the free plan continues · No card, no charge